
Elevate Your Code: How Developers Leverage PostHog for Building Better Software

Introduction
Building a great software is more than just writing code , it’s about understanding users, fixing issues fast, and shipping features confidently. Developers need more than a code editor; they need visibility into user behavior, performance issues, and feature usage.
Unlike typical analytics tools built for product teams, PostHog is designed with engineers in mind, PostHog is an open-source, all-in-one platform offering product analytics, session replay, feature flags, A/B testing, error tracking and more.
Deep Dive on Posthog
Now that we’ve covered why PostHog matters to developers, let’s explore how it works under the hood , starting with events, the building blocks of all analytics.
Events in Posthog
At the heart of PostHog and any analytics platform are events.
In PostHog, events represent user interactions with your app or website, forming the core data unit. These events can be as simple as a button click or as complex as a purchase and can be customized to track specific user behaviors
PostHog comes with extensive out-of-the-box event tracking, automatically capturing a wide range of properties from browser and OS details to location (country, city via IP), browser language, current URL, and more.
This rich context powers advanced features like:
• Rage click detection
• Session replays
• Funnel analysis
• Retention tracking
With these insights, developers can understand user behavior in depth and continuously improve the product experience.
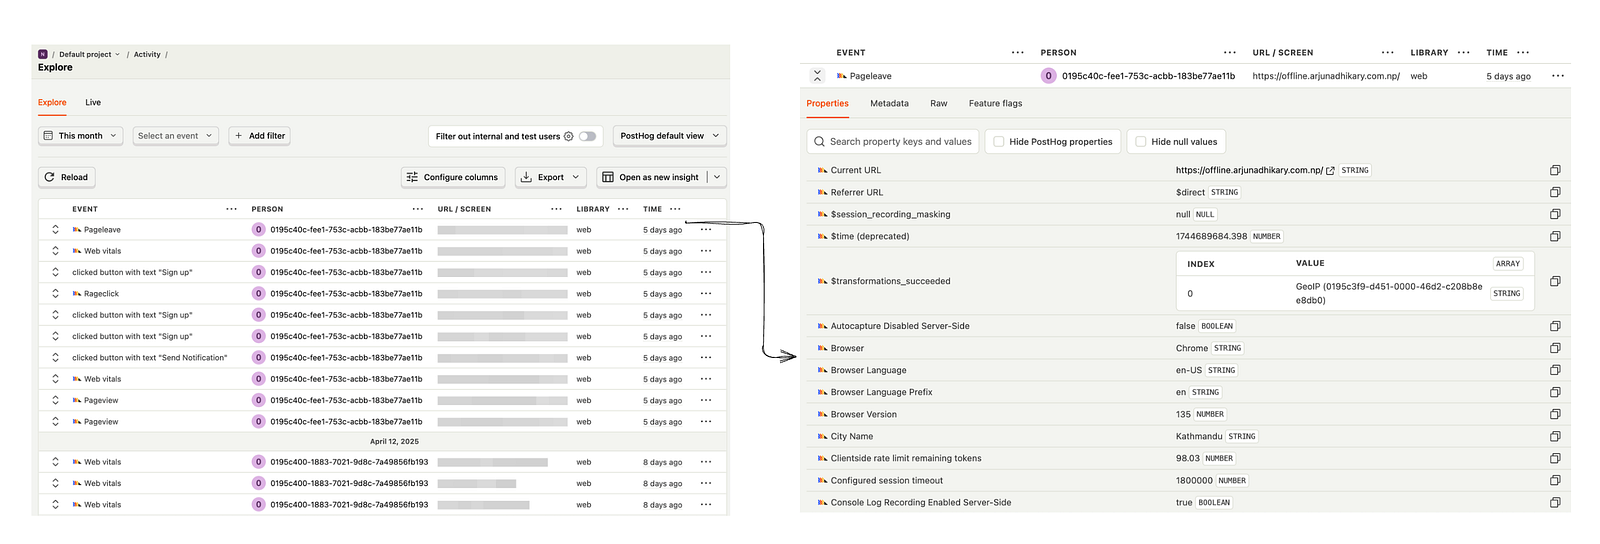
Fig: example of events and what properties are captured under each events
Ways to capture events in posthog
Automatic event capture:
Imagine a user clicks on a “Sign Up” button. PostHog will automatically track this action as an event, capturing key details such as the URL of the page the user was on at the time, the browser and operating system they were using, and the time of the click.
Manual event capture:
Let’s say you want to track when a user completes a purchase in your app. Instead of relying on PostHog’s automatic capture, you can define a custom event to track the exact amount spent and the items purchased.
posthog.capture('purchase_completed', {
  total_amount: 49.99,
  items_purchased: ['Product A', 'Product B'],
});
This event would now give you detailed insight into user behavior after they make a purchase, including which products are most popular and how much users are spending.
From Code to Insights: How PostHog Helps You Build Better
While this guide focuses on developers, PostHog’s all-in-one toolkit is built to support entire product teams , from engineers to marketers, analysts, and founders. Whether you’re shipping code, analyzing user behavior, or making data-driven decisions, PostHog brings powerful tools into a single platform.
Let’s break down what makes it so effective.
1) Unified Tooling: Simplifying the Developer Stack
Developers often juggle multiple tools for analytics, error tracking, feature flagging, and A/B testing. PostHog consolidates these into a single platform
As developers, we’re naturally drawn to tools that unify and simplify. Whether it’s a framework, library, or package, we tend to appreciate solutions that bring multiple capabilities under one roof. The less context-switching and integration overhead, the better.
Integrating PostHog into a development workflow is designed to be straightforward
For instance, embedding the following snippet within the <head> tags of an HTML document provides immediate access to PostHog's core functionalities
<script>
   !function(t,e){var o,n,p,r;e.__SV||(window.posthog=e,e._i=,e.init=function(i,s,a){function g(t,e){var o=e.split(".");2==o.length&&(t=t[o],e=o[1]),t[e]=function(){t.push([e].concat(Array.prototype.slice.call(arguments,0)))}}(p=t.createElement("script")).type="text/javascript",p.crossOrigin="anonymous",p.async=!0,p.src=s.api_host.replace(".i.posthog.com","-assets.i.posthog.com")+"/static/array.js",(r=t.getElementsByTagName("script")).parentNode.insertBefore(p,r);var u=e;for(void 0!==a?u=e[a]=:a="posthog",u.people=u.people||,u.toString=function(t){var e="posthog";return"posthog"!==a&&(e+="."+a),t||(e+=" (stub)"),e},u.people.toString=function(){return u.toString(1)+".people (stub)"},o="init capture register register_once register_for_session unregister unregister_for_session getFeatureFlag getFeatureFlagPayload isFeatureEnabled reloadFeatureFlags updateEarlyAccessFeatureEnrollment getEarlyAccessFeatures on onFeatureFlags onSessionId getSurveys getActiveMatchingSurveys split(" "),n=0;n<o.length;n++)g(u,o[n]);e._i.push([i,s,a])},e.__SV=1)}(document,window.posthog||);
    posthog.init('<ph_your_project_api_key>', {api_host: 'https://us.i.posthog.com'})
</script>
For projects utilizing JavaScript you can use your favourite package managers like pnm, npm or yarn
2) Product Analytics & Autocapture: Understanding Usage with Less Effort
Sure, you’ve heard the buzzwords : DAU, MAU, Funnels, Retention, Churn, Cohorts. Analytics platforms often throw these terms around and expect developers to tag every button, track every event manually, and dig through complex dashboards like they’re solving a crime scene.
Tools like Google Analytics or Mixpanel offer some level of automatic tracking, but often still require manual setup, custom events, or limited flexibility.
But posthog flips that script, with built-in autocapture, it automatically tracks clicks, page views, and form interactions right out of the box. No extra code, no tracking plan spreadsheets. Just real insights, built for developers who want to understand how their features are actually used.
Let’s say you just shipped a new onboarding flow with a few “Next” buttons and a feedback form at the end.
Without writing a single tracking line, PostHog will automatically capture:
• How many users clicked “Next”.
• Whether they completed the onboarding flow.
• If they submitted feedback and on what page they dropped off.
You can then view all of this in funnels, heatmaps, or session replays without touching your code again.
3) Session Replay: See What Your Users See Without the Guesswork
The PostHog UI for session replay typically includes an event timeline, console logs, and network monitoring tools, providing a comprehensive view of the user’s experience at a granular level

Session replay captures user interactions exactly as they happened , not by recording their screen, but by cleverly capturing DOM changes and replaying them like a movie.
It’s like a developer-friendly time machine 🔄 that lets us watch how users navigated, clicked, scrolled, and sometimes… rage-quit.
This visual insight helps with a ton of use cases:

But here’s the thing , watching user sessions can feel a bit invasive at first.
You might ask:
“Wait, someone can literally replay my clicks? Isn’t that a privacy red flag?”

Fig: ensure data privacy with posthog
So yes, session replay is powerful but in PostHog, it’s built for
debugging with empathy
4) Error Tracking
Error tracking is one of my personal favorite feature in PostHog.
It acts as a robust logger for both your frontend and backend, offering enhanced features and ease of use compared to traditional logging methods.
This enables us to track, investigate, and resolve issues the users encounter in real-time, providing valuable insights for proactive debugging and improvement of the application.
Because posthog is an all-in-one platform, we can use any reported errors to create insights, filter recordings, trigger surveys etc.
This means, for example, we can seamlessly find session replays of specific errors when trying to debug root causes, or send crash surveys to users whenever an exception is triggered.
The default event Exception provides sufficient information about errors
There are two ways to capture exception:
4.1) Setting up exception autocapture
we can enable exception autocapture for the JavaScript Web SDK in the Error tracking section of your project settings.
When enabled, this automatically captures $exception events when errors are thrown by wrapping the window.onerror and window.onunhandledrejection listeners.
// Check if we're in the browser environment
if (typeof window !== 'undefined') {
  // Initialize PostHog with your project API key
  posthog.init('your-project-api-key', {
    autocapture: true, // Automatically capture events
  });

  // Capture global JavaScript errors
  window.onerror = function (message, source, lineno, colno, error) {
    posthog.capture('$exception', {
      message: message,
      source: source,
      lineno: lineno,
      colno: colno,
      error: error,
    });
    return true; // Prevents the default browser error handling
  };

  // Capture unhandled promise rejections
  window.onunhandledrejection = function (event) {
    posthog.capture('$exception', {
      message: event.reason.message,
      stack: event.reason.stack,
    });
  };

  // Clean up when the page is unloaded
  window.addEventListener('unload', function () {
    posthog.shutdown(); // Optional cleanup to ensure PostHog is properly shut down
  });
}
4.2) Manual error capture
It is also possible to manually capture exceptions using the captureException method:
posthog.captureException(error, additionalProperties)
4.3) Uploading source maps
Source maps are like a translator for your website’s code. They connect the compressed, fast-loading code your users see back to the original, readable code you wrote, making debugging errors in production much easier.
Because the source maps are likely not publicly hosted in a typical Next.js deployment, PostHog won’t be able to automatically find and use them to deminify your stack traces. This is where the posthog-cli sourcemap upload command comes in.
npm run build && \
posthog-cli sourcemap inject --directory ./.next && \
posthog-cli sourcemap upload --directory ./.next && \
npm run start
Danger : don’t use this in production, it exposes your sourcemap
Probably what you need to do is create your own CI/CD pipeline for this
do not upload source map files to the production server
Please refer to PostHog’s error tracking installation guide for instructions on uploading source maps.
Uploading source maps for frontend projects like React or Next.js enables detailed stack traces, making it easier to pinpoint the exact component or page where an error originated.
Note : Under Error tracking you will see list of all exception, click on anyone of the exception to view detailed information about the exception.

Fig: List of all the errors in the app
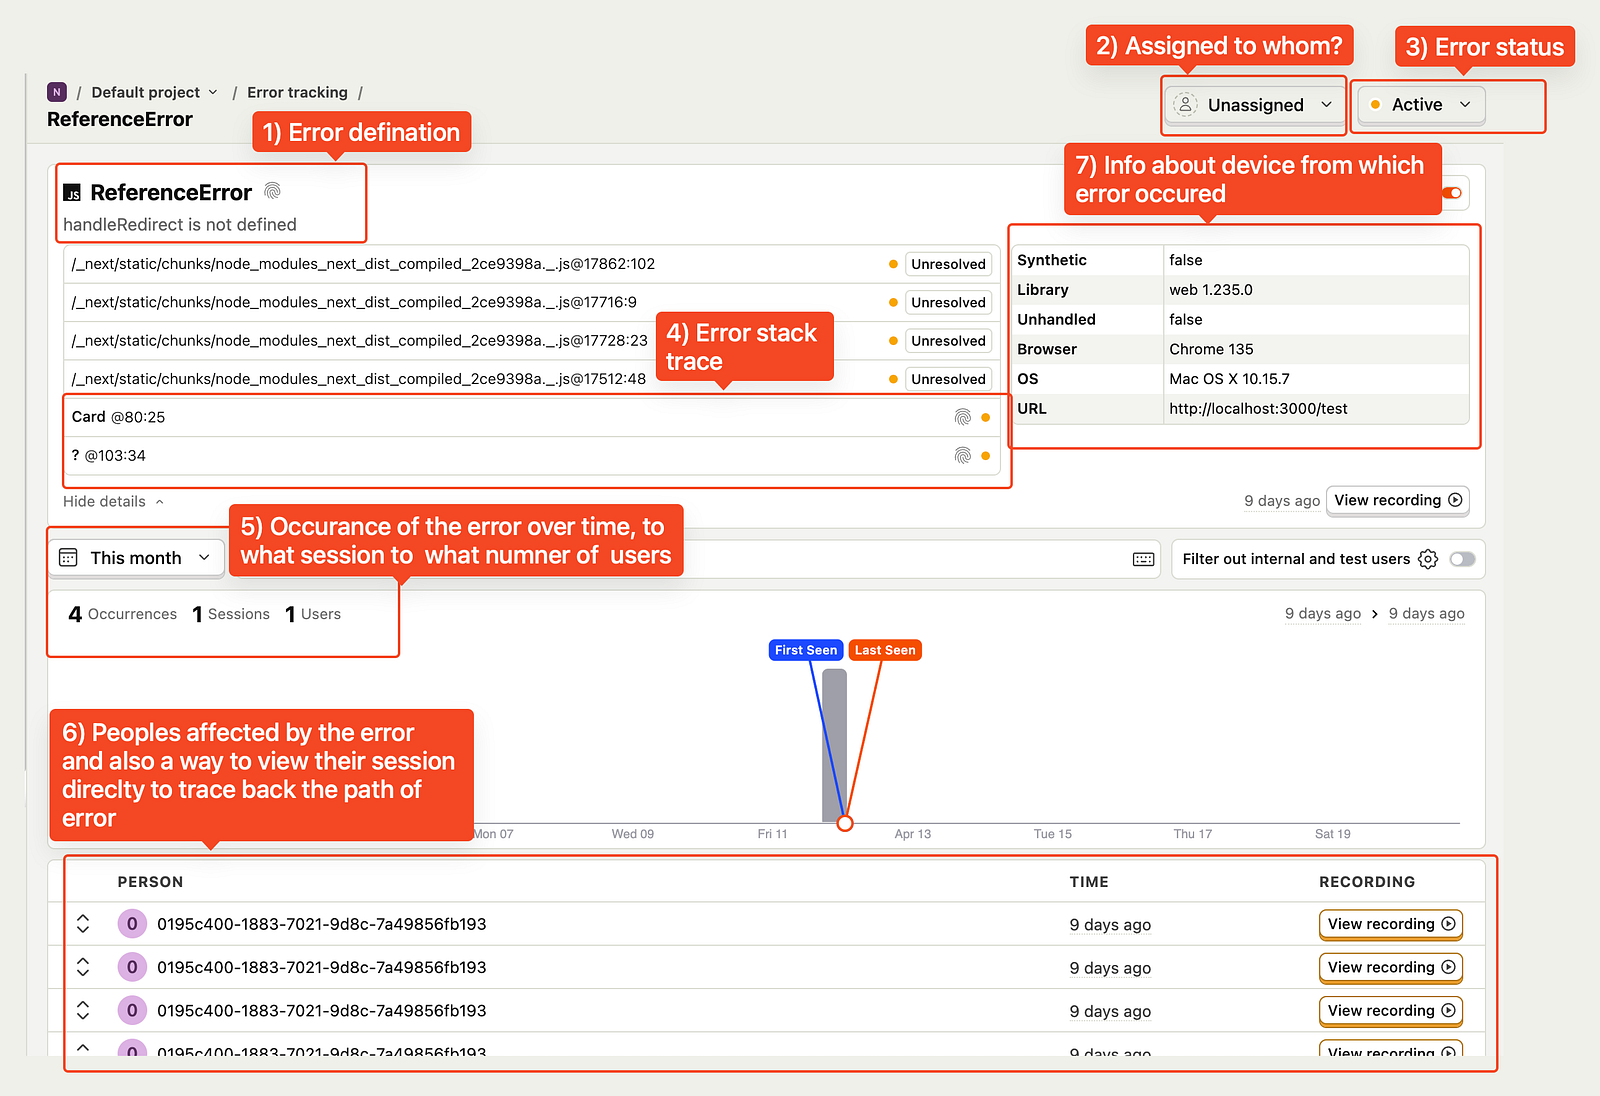

Fig: Error tracking feature from posthog in production
Prior to PostHog’s error tracking release, understanding the user context behind errors was a cumbersome, multi-step process. Now, with this new feature, we gain instant clarity by viewing errors alongside the user’s session replay.
5) Automated Error Alerts with PostHog
On top of that, you can add notifications using webhooks or email to stay in the loop when things go wrong.
Under Product Analytics → Alerts → New Insight, you can create alerts to monitor key events and stay ahead of issues.

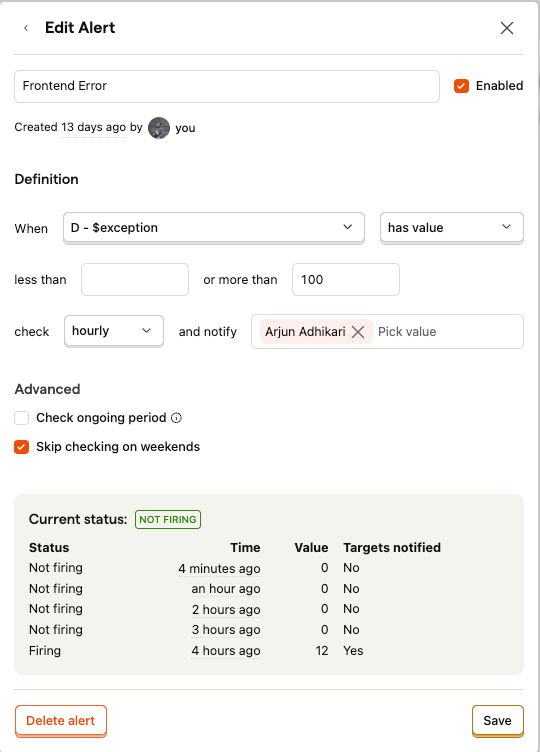
This example tracks $exception events. If errors go above 100 per hour, PostHog will:
✅ Trigger an enabled alert
📩 Notify anyone(via webhooks, email, etc.)
📅 Skip weekends
🟢 Show live status (last alert fired 4 hours ago with 12 exceptions)
This setup is great for catching frontend error spikes with no self-hosting required. Stay proactive and ensure smooth user experience

6) Setting Reverse Proxy with cloudflare:
If a user is behind an ad blocker or using privacy-focused browsers like Brave, default event tracking with PostHog can be blocked.
Ad blockers have the potential to disable the feature flags, which can lead to bad experiences, such as users seeing the wrong version of app, or missing a new feature rollout.
A simple workaround is to use a reverse proxy.
There are multiple ways to set this up, but using a Cloudflare Worker is one of the easiest and most effective methods.
A reverse proxy allows us to send events to PostHog Cloud via our own subdomain (e.g., test.yourdomain.com) instead of the default endpoints like us.i.posthog.com or eu.i.posthog.com.
It helps bypass ad and tracker blockers, allowing you to capture more complete usage data , all without having to self-host PostHog.
we can set up a reverse proxy using Cloudflare Workers (works on all plans with more setup flexibility) or DNS + Page Rules (simpler, but only available on the Enterprise plan).
Workers are really powerful and allow up to 100,000 requests per day on the free plan
const API_HOST = "us.i.posthog.com"
const ASSET_HOST = "us-assets.i.posthog.com"

async function handleRequest(request, ctx) {
  const url = new URL(request.url)
  const pathname = url.pathname
  const search = url.search
  const pathWithParams = pathname + search

  if (pathname.startsWith("/static/")) {
    return retrieveStatic(request, pathWithParams, ctx)
  } else {
    return forwardRequest(request, pathWithParams)
  }
}

async function retrieveStatic(request, pathname, ctx) {
  let response = await caches.default.match(request)
  if (!response) {
    response = await fetch(`https://${ASSET_HOST}${pathname}`)
    ctx.waitUntil(caches.default.put(request, response.clone()))
  }
  return response
}

async function forwardRequest(request, pathWithSearch) {
  const originRequest = new Request(`https://${API_HOST}${pathWithSearch}`, {
    method: request.method,
    headers: new Headers({
      ...Object.fromEntries(request.headers),
      'Host':
    }),
    body: request.body,
    redirect: 'manual',
  })

  originRequest.headers.delete("cookie")

  return await fetch(originRequest)
}

export default {
  async fetch(request, env, ctx) {
    return handleRequest(request, ctx)
  }
}
All you need is this template code under
Cloudflare Dashboard → Workers & Pages → Create a new Worker.
Follow this straightforward guide:
https://posthog.com/docs/advanced/proxy/cloudflare
In the project repo where posthog is initilised:
posthog.init('your_project_api_key', {
// your proxy subdomain
  api_host: 'https://your_proxy_domain.com',
// required for features like toolbar, use us or eu depending on your region
  ui_host: 'https://us.posthog.com',
})
6.1) Best Practices For Reverse Proxy
Ensure your proxy sets the correct Host header and avoid using subdomains with words like “posthog” or “analytics” to prevent blocking. Also, set the ui_host during PostHog initialization to ensure features like the toolbar work correctly.
7) Feature Flags: Implementing Control and Confidence in Code
Feature flags provide developers with a powerful mechanism to decouple code deployment from feature release, enabling safer and more flexible rollouts.
PostHog’s feature flag functionality allows developers to implement the control directly within their codebase using simple conditional logic based on the flag’s status.
Checking the status of a boolean feature flag (either enabled or disabled) can be done using the posthog.isFeatureEnabled() method in JavaScript:
if (posthog.isFeatureEnabled('new_dashboard')) {
    // Display the new dashboard
} else {
    // Display the old dashboard
}
Progressive Rollouts: Slowly increase % of users who see a new feature using PostHog’s rollout slider.
Targeted Releases: Deliver features only to specific users, teams, or cohorts ensuring the sensitive or experimental features are only visible to intended audiences..
Kill Switch: Set flag to ‘off’ to instantly disable feature.
Then pair it with a PostHog survey to gather user feedback on the new dashboard experience.

Fig: Implementing Feature Flags
You can explore these capabilities firsthand in my https://github.com/arjun-rumsan/posthog-demo GitHub repo where I’ve built a demo app using Next.js to showcase the basics.
Conclusion
In conclusion, PostHog makes event tracking a breeze with automatic capture, so developers don’t have to drown in a sea of tracking code. Focus on building, not on debugging event floods.
This, combined with its powerful features like error monitoring, feature flagging, session replay, and product analytics, makes PostHog an invaluable tool for efficient and streamlined development workflows.